
Residents are desperately “paying off debts and saving money”, and the wealth accumulation model that has lasted for more than twenty years is now reversing.
In the past twenty years, the wealth accumulation of Chinese residents has been closely linked and deeply integrated with the real estate market. Buying a house, increasing leverage, and waiting for appreciation was a path that once allowed countless families to achieve wealth leaps. However, this path is now reversing.
I. Residents are “desperately paying off debts”
Before 2022, the monthly new additions to residents’ medium and long-term loans mostly ranged from 300 billion to 700 billion yuan. However, after entering 2022, the growth center has significantly moved downwards, and even experienced significant negative growth. By April 2026, residents’ medium and long-term loans declined by 340.8 billion yuan in a single month, with the scale of repayment exceeding the scale of new issuance.
Even more noteworthy is that during the first half of 2026, residents’ loans experienced a net repayment for the first half-year, amounting to 366.8 billion yuan—a situation that has never happened in history.
The household leverage ratio has decreased from 62.3% in the first quarter of 2024 to 59.0% in the first quarter of 2026, and has been deleveraging continuously since the second quarter of 2024. A report by Goldman Sachs also noticed the same trend, with the leverage ratio continuously decreasing since mid-2024, mainly driven by the continuous decline in mortgage loan balances.
How intense is the early repayment of loans? A report by Southwest Securities, “Decoding the New Picture of China’s Household Assets and Liabilities,” calculated that as of June 2023, the scale of household early loan repayments reached 454.1 billion to 609.9 billion yuan. The balance of personal housing loans has fallen from a peak of 38.8 trillion yuan at the beginning of 2022 to 36.72 trillion yuan at the beginning of 2026.
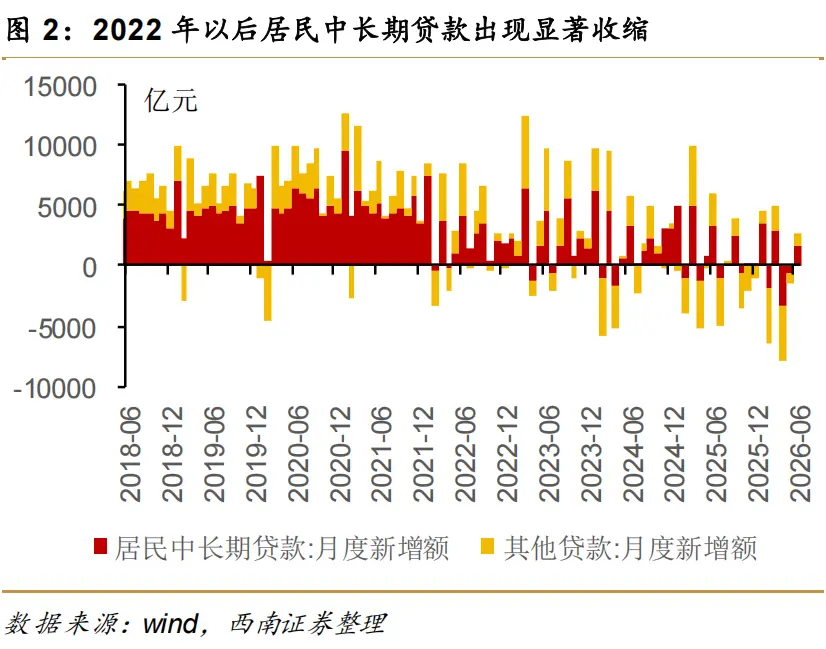
Southwest Securities: Medium and long-term loans for residents have significantly contracted since 2022
II. Why are people afraid to borrow money?
Two structural forces are at play.
Changes in demographic structure. Among them, the population aged 25 to 44, which is the main group for purchasing homes, accounted for 34.36% in 2003, and this figure has dropped to 27.81% in 2024. In addition, the net increase in urban population has decreased from 29.49 million in 2011 to 10.3 million in 2025, a decrease of more than 65%. This indicates that new housing demand is showing a systematic contraction trend.
Risk appetite completely reshaped. At the end of 2025, the proportion of residents who preferred “more savings” increased to a historically high level of 62.9%, while the proportion of “more investment” decreased to a historically low level of 14.6%.
A Goldman Sachs report further indicates that the ratio of Chinese household debt to GDP is about 59%, which appears lower than the US’s 70%. However, the ratio of debt to disposable income is as high as about 140%. The reason is that Chinese household disposable income only accounts for 45% of GDP, unlike the US, which accounts for about 75%. While debt appears controllable relative to total output, it is much more burdensome relative to the income households actually receive.
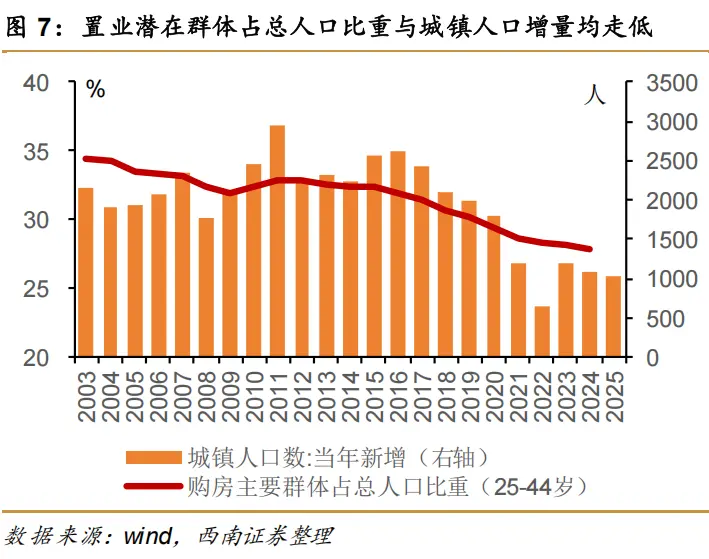
The proportion of potential home buyers in the total population and the increase in urban population are both declining
III. Worries behind “desperately saving money”
China’s household savings rate has long remained between 30% and 40%. In June 2026, it was 35.44%, while in the same period, the US was only 2.83%.
A more critical point lies in the structure of savings. In May 2026, the proportion of time deposits in household deposits soared to 74.8%, reaching a historical high. By June, this proportion was 74.29%, still at a high level. The growth rate of time deposits was 8.19%, significantly higher than the growth rate of demand deposits at 3.98%.
Household savings, originally funds called “liquid money” used to meet short-term transactions, have now changed and become a “safety net” for long-term expenditures such as pensions and medical care.
The main driver is aging. In 2000, the proportion of the population aged 65 and above was 7.0%. By 2025, this proportion rose to 15.9%, growing faster than the global average. The proportion of medical expenses covered by insurance within the catalog is only about 66%, and residents still have to bear a considerable proportion of medical expenditure risks. Employment expectations are showing a weakening trend. In June 2026, the employment expectation index fell from 77.2 to 73.7. In this situation, residents can only choose to save in time deposits.
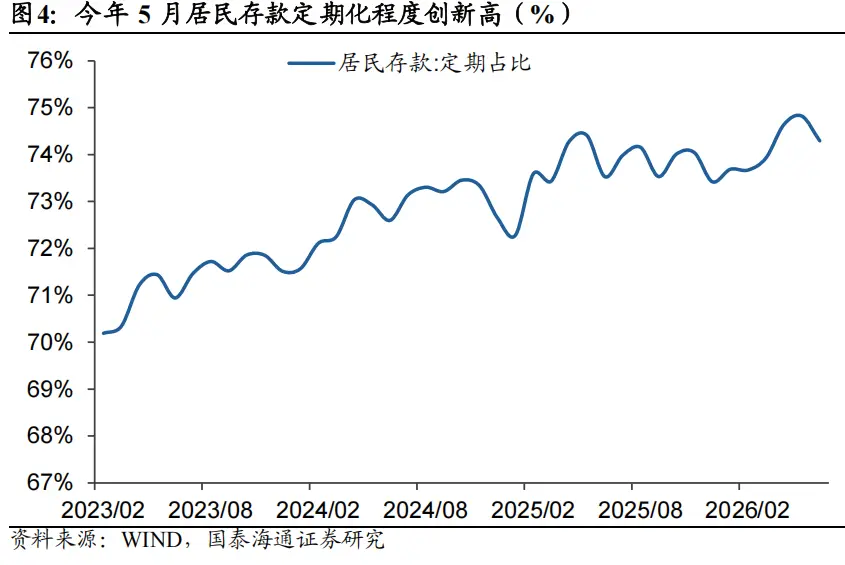
The degree of time deposit of household savings reached a new high in May this year
IV. “Deposit migration” accelerates, where has the money gone?
On the one hand, residents are doing their best to accumulate wealth, and on the other hand, they are accelerating “deposit transfers.”
In the first half of 2026, new household deposits reached 7.6 trillion yuan, the lowest for the same period since 2022, a decrease of about 3.2 trillion yuan year-on-year; new non-bank deposits were 4.7 trillion yuan, nearly doubling compared to last year. The growth rate of household deposits has fallen to 7.1%, and the scissor difference between it and M2 growth has turned from a positive 1.2 percentage points to a negative 0.9 percentage points, indicating a significant acceleration in fund transfers.
Calculations show that in 2026, the scale of maturing time deposits in the entire market is expected to be between 113 trillion and 229 trillion yuan, which is an unprecedented maturity peak.
However, the “migration” is not towards high-risk assets. The willingness to renew time deposits remains very strong, and funds are significantly concentrated in large banks. Personal time deposits in small and medium-sized banks have decreased by 1.56 trillion yuan year-on-year, while large banks have increased by 880 billion yuan. The growth rate of time deposits in large banks is 15.1%, while that in small and medium-sized banks is only 8.1%, a difference of 7 percentage points. In fact, this is “defensive migration.”
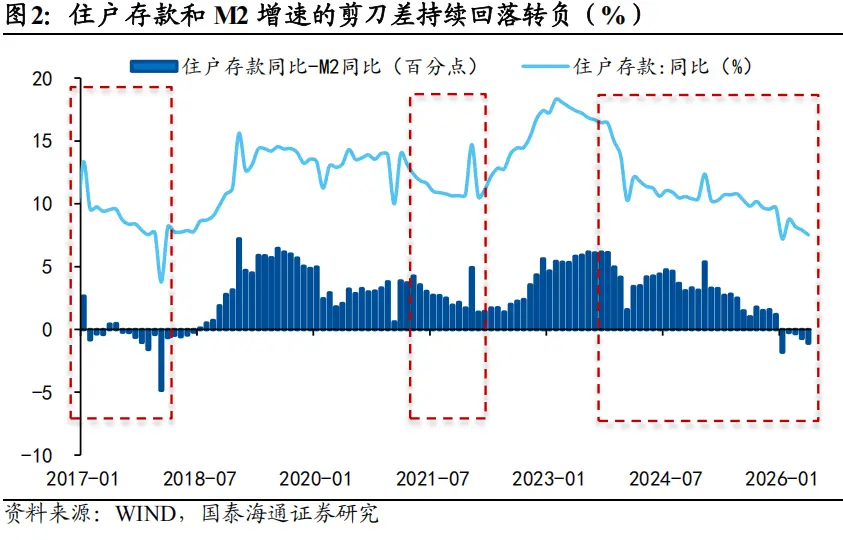
The scissor difference between household deposit growth and M2 growth continues to decline and turn negative
V. “K-shaped” differentiation of fund flows
Guotai Haitong reveals a key characteristic: fund flows are highly resonant with the “K-shaped” differentiation of the economy.
On the “lower K” end, funds are mainly flowing into low-risk products such as wealth management, money market funds, bond funds, and “fixed income+.” The proportion of hybrid bond funds in bond funds increased from 14.4% in mid-2025 to nearly 25% in mid-2026, indicating a clear trend of expansion in “fixed income+.” However, traditional stock mutual funds have experienced net redemptions. In the first 6 months, net redemptions of shares were about 400.5 billion, which is even lower than last year, when there were 585 billion new shares.
On the “upper K” end, corporate funds and high-net-worth individuals are accelerating their entry. The year-on-year growth rate of private fund management scale has reached 44.5%, and the year-on-year growth of non-broad-based stock ETF holdings is about 60%.
The divergence of fund flows between the retail and high-end segments is a projection of the “K-shaped” differentiation of wealth structure in the financial market.
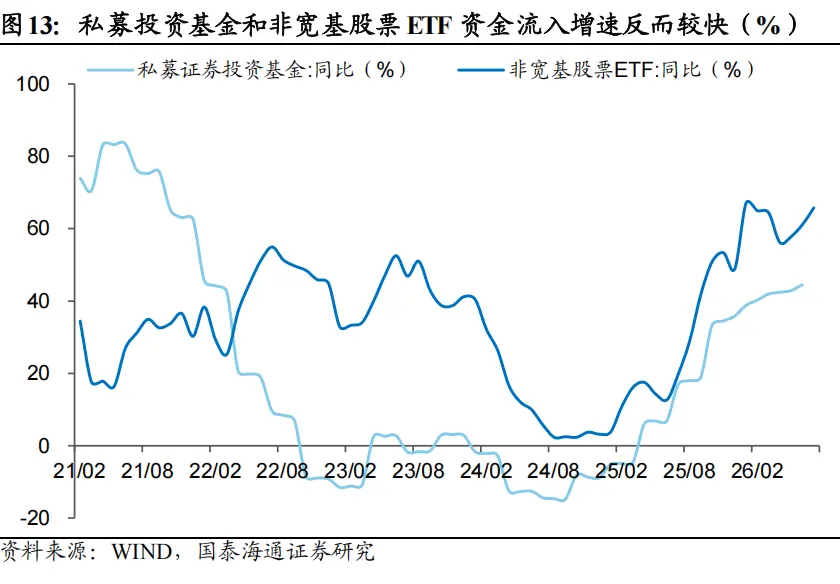
The inflow growth rate of funds into private investment funds and non-broad-based stock ETFs is showing a rapid trend
VI. Historic shift in asset allocation
According to quarterly tracking data from Goldman Sachs, the total assets of Chinese households reached a peak at the beginning of 2023 and have been declining for about six quarters, stabilizing at around 730 trillion yuan recently.
More importantly, the asset structure has changed. In mid-2021, real estate, cash/deposits, and other financial assets accounted for 67%, 16%, and 15% respectively. By the first quarter of 2026, this changed to 52%, 25%, and 20%—the proportion of real estate decreased by 15 percentage points in five years, while deposits and financial assets increased by 9 and 5 percentage points, respectively.
Goldman Sachs predicts that by 2035, the proportion of real estate may fall to about 42%, while stocks will rise from about 6% to 11%, and insurance will increase from about 6% to 10%.
However, this transformation will be slow and gradual. The experiences of Japan and the United States show that after a real estate bubble bursts, the reallocation of households towards financial assets is generally a long and arduous process. More than 70% of residents can accept a maximum drawdown of no more than 10%—a low risk tolerance determines that wealth reallocation cannot be achieved overnight.
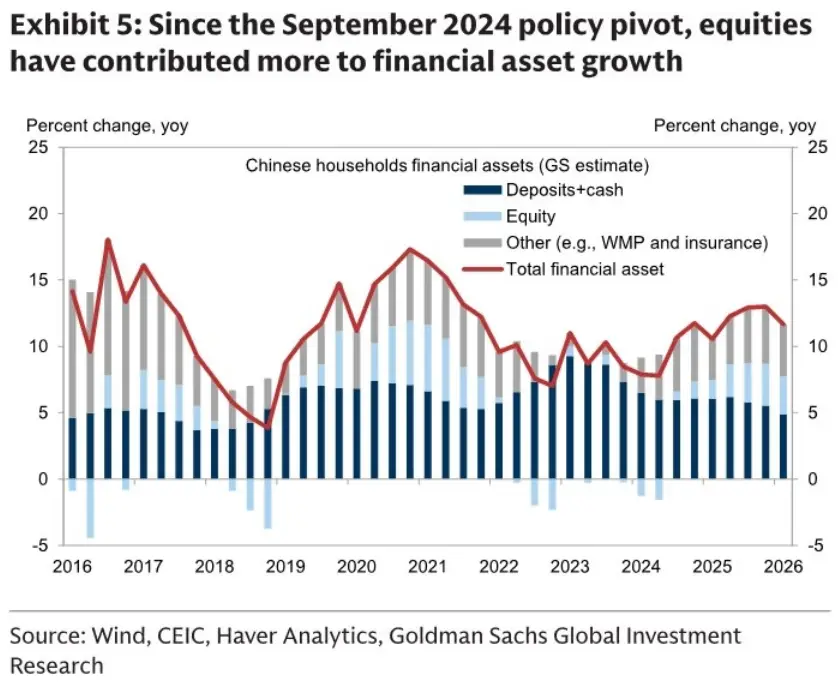
Since the policy shift in September 2024, stocks have contributed more to the growth of financial assets
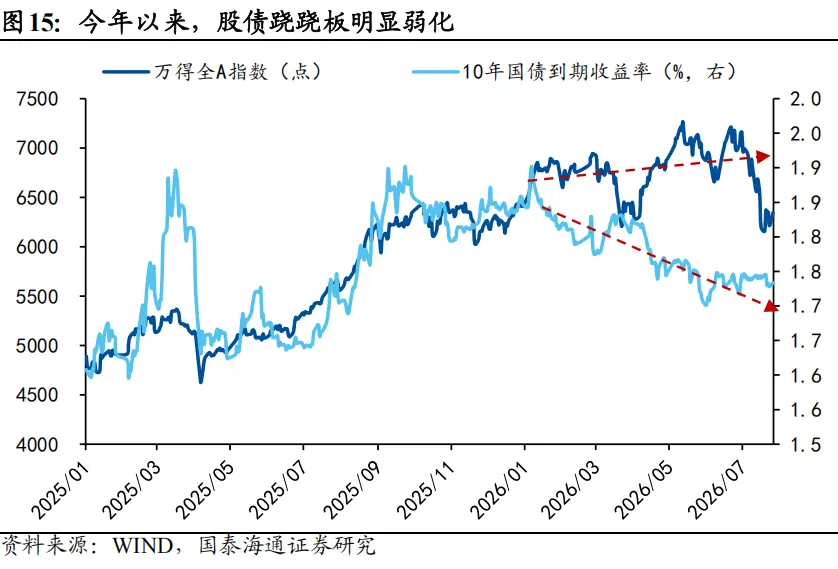
The stock-bond seesaw has significantly weakened this year
The ratio of Chinese household debt to GDP is about 59%, lower than the US’s 70%. The problem is not how high the debt ratio is, but that the household sector is undergoing a systemic transformation from “active deleveraging” to “passive deleveraging.” Structural forces such as population aging, slowing urbanization, and the long-term peak of real estate suggest that this may be a long-term process.
Residents “no longer borrowing to buy homes” does not mean funds are exiting, but rather that the wealth management model is shifting from real estate-driven to financial asset-driven. However, this is a long and potentially painful road.
Discover more from 自由档案馆
Subscribe to get the latest posts sent to your email.