On November 30, Vice Premier Sun Chunlan mentioned at a symposium of the National Health Commission that “China’s epidemic prevention and control is facing a new situation and new tasks.”
On December 7, the “New Ten Articles” were issued, and asymptomatic infected persons and mild cases were allowed or even encouraged to take home isolation.
The nearly three-year-long zero-COVID policy finally ended completely in a dramatic U-turn of less than a week.
False case data
Many cities had already taken the first step and moved towards mass infection before the policy U-turn.
We can see information on the Internet that Shijiazhuang, Baoding and other places are constantly experiencing severe epidemics, and there are long queues at fever clinics. Many friends in Beijing are also seeing more and more positive cases around them, and the density has far exceeded the Shanghai epidemic.
However, such “mass infection” does not seem to be supported by the data. The figure below lists the daily new cases in Baoding, Shijiazhuang and Beijing in recent months, including the newly confirmed local cases and the newly added asymptomatic infections.
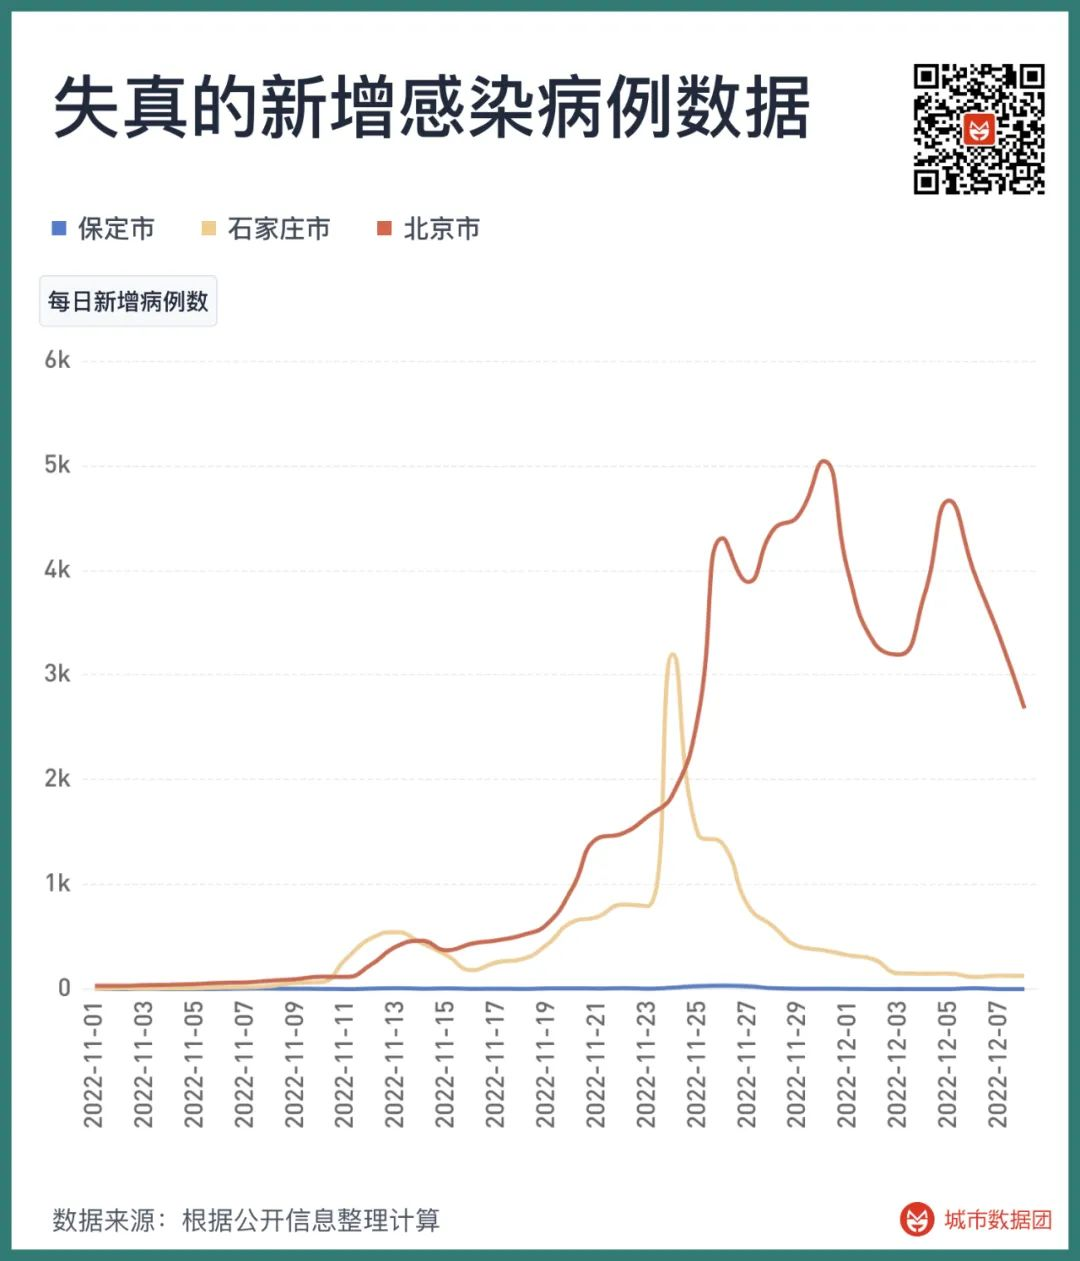
As you can see, the number of new cases in Beijing is gradually decreasing; the number of new infections in Shijiazhuang peaked on November 24, and then rapidly declined. And Baoding… Baoding can’t see any epidemic at all. Except for 33 new infections on November 26, the number of new infections in Baoding has been basically stable at single digits at other times.
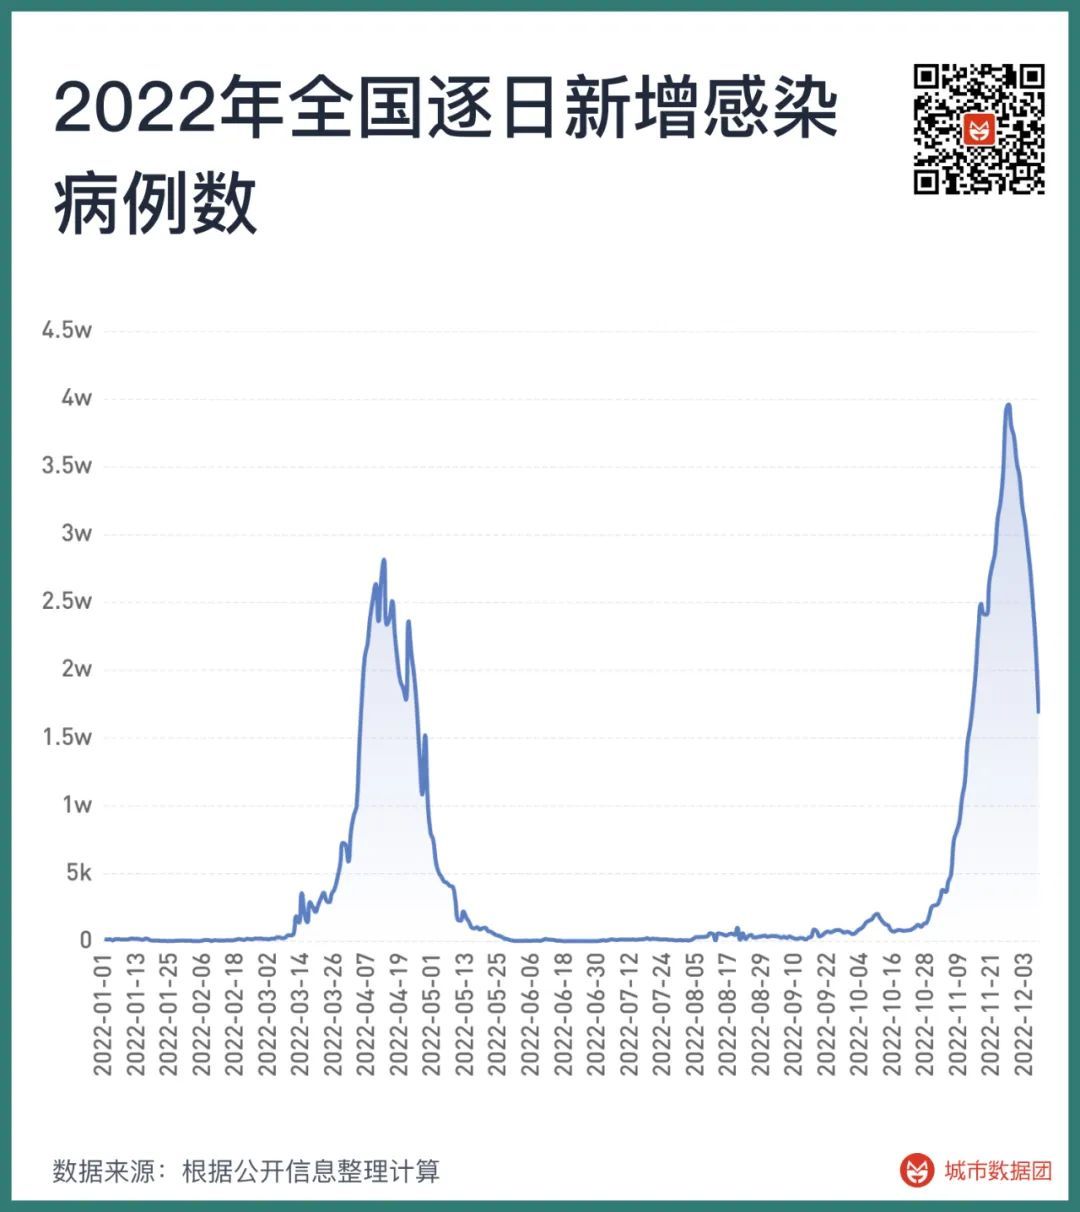
Not only these three cities, but from a national perspective, the number of new infections also peaked on November 27 and then quickly fell back. After the command stick of epidemic prevention and control disappeared, the data of case growth immediately became invalid. At this time, how do we judge whether a city has experienced mass infection?
Search index can be of great help at this time.
As early as more than a decade ago, studies used Google search index to predict the outbreak of influenza. These studies have been proven to have problems in prediction afterwards, but they have always done a good job in real-time monitoring. The figure below lists the relationship between the “fever” search index and the number of weekly cases in Hong Kong Special Administrative Region, Taiwan region, Singapore and Japan since 2022.
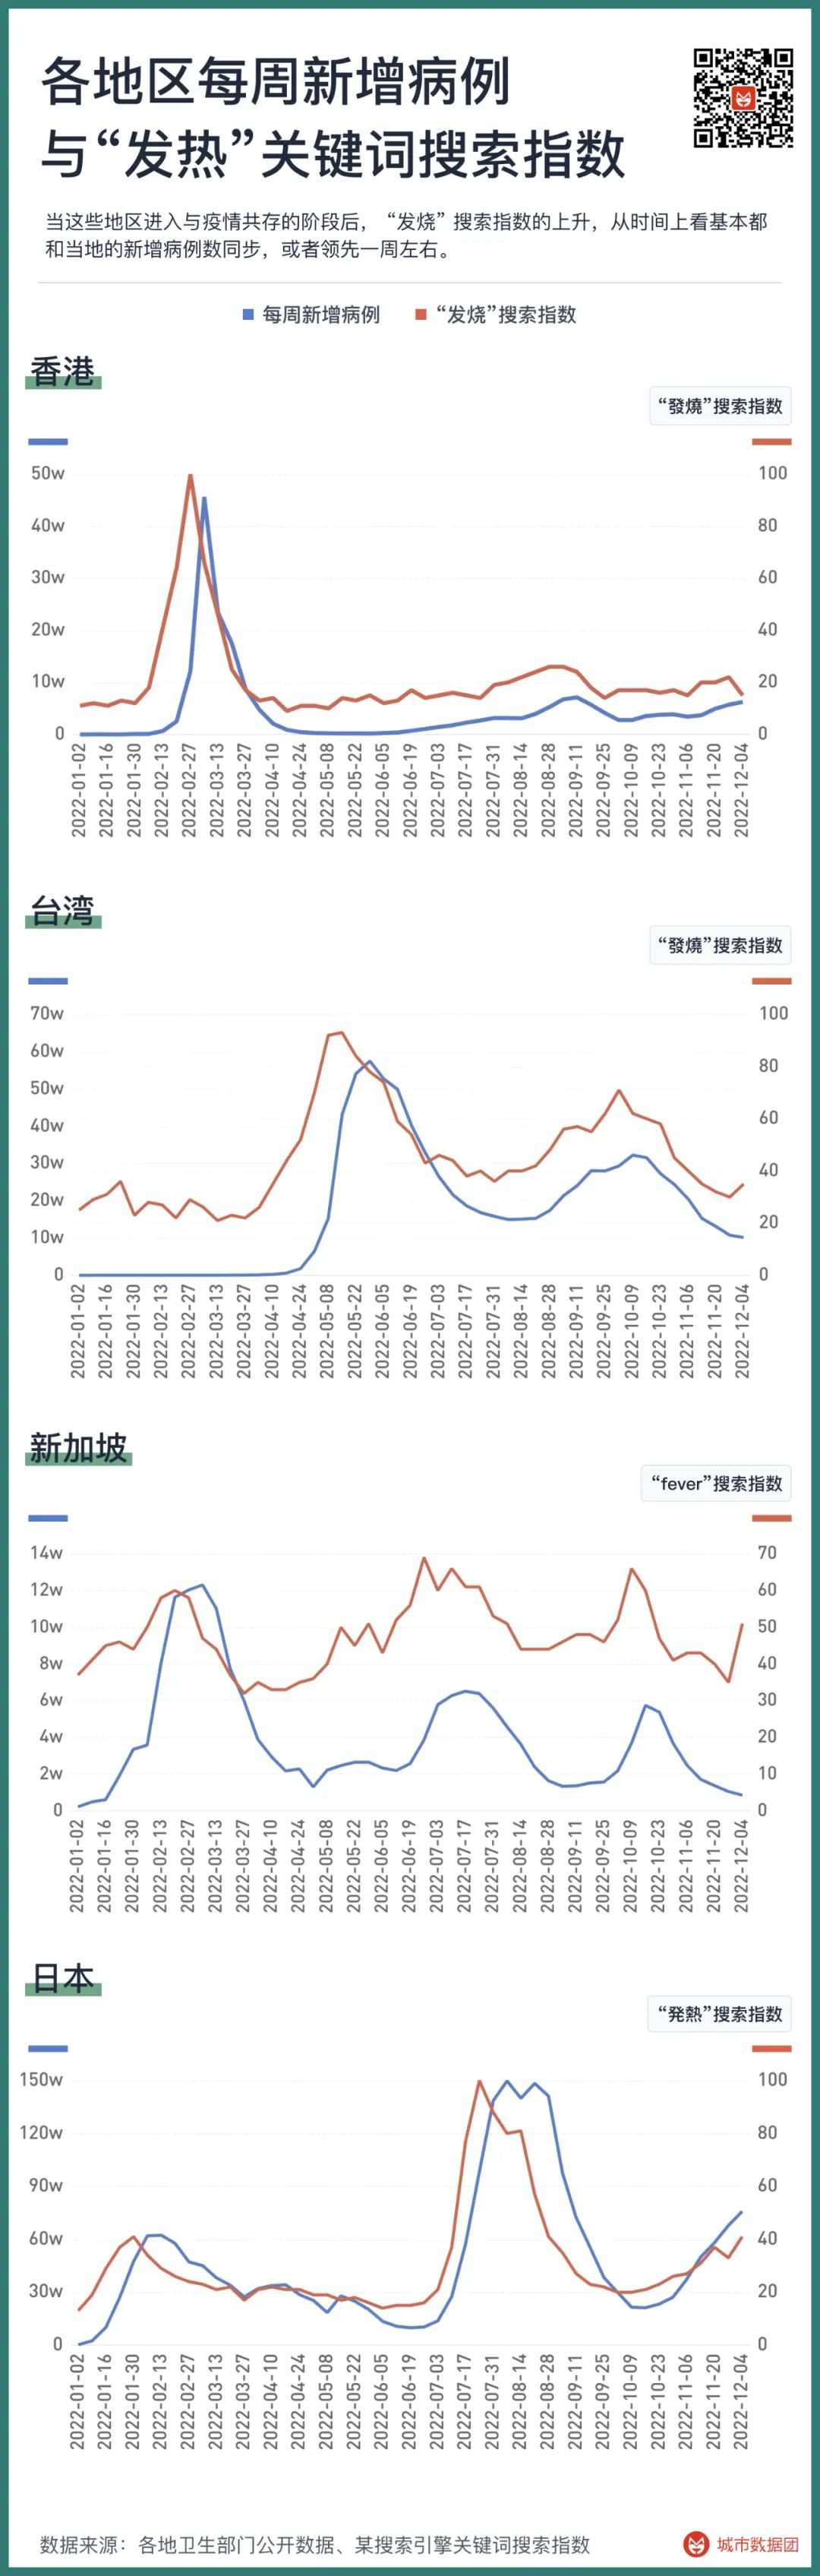
Among them, the search index in Hong Kong Special Administrative Region and Taiwan region is “發燒”, Singapore uses “fever”, and Japan uses “発熱”.
It can be seen that after these regions entered the stage of coexisting with the epidemic, the rise of the “fever” search index is basically synchronized with the number of new cases in the local area, or leads by about a week. From the perspective of the increase, except for the slight misalignment between the search index brought by the first wave of cases in Singapore and the case growth of the latter two epidemics, the case growth of the other three countries or regions in different waves basically maintains the same proportion with the search of “fever” index.
So, what are the “fever” search indexes of Beijing, Shijiazhuang and Baoding at this time?
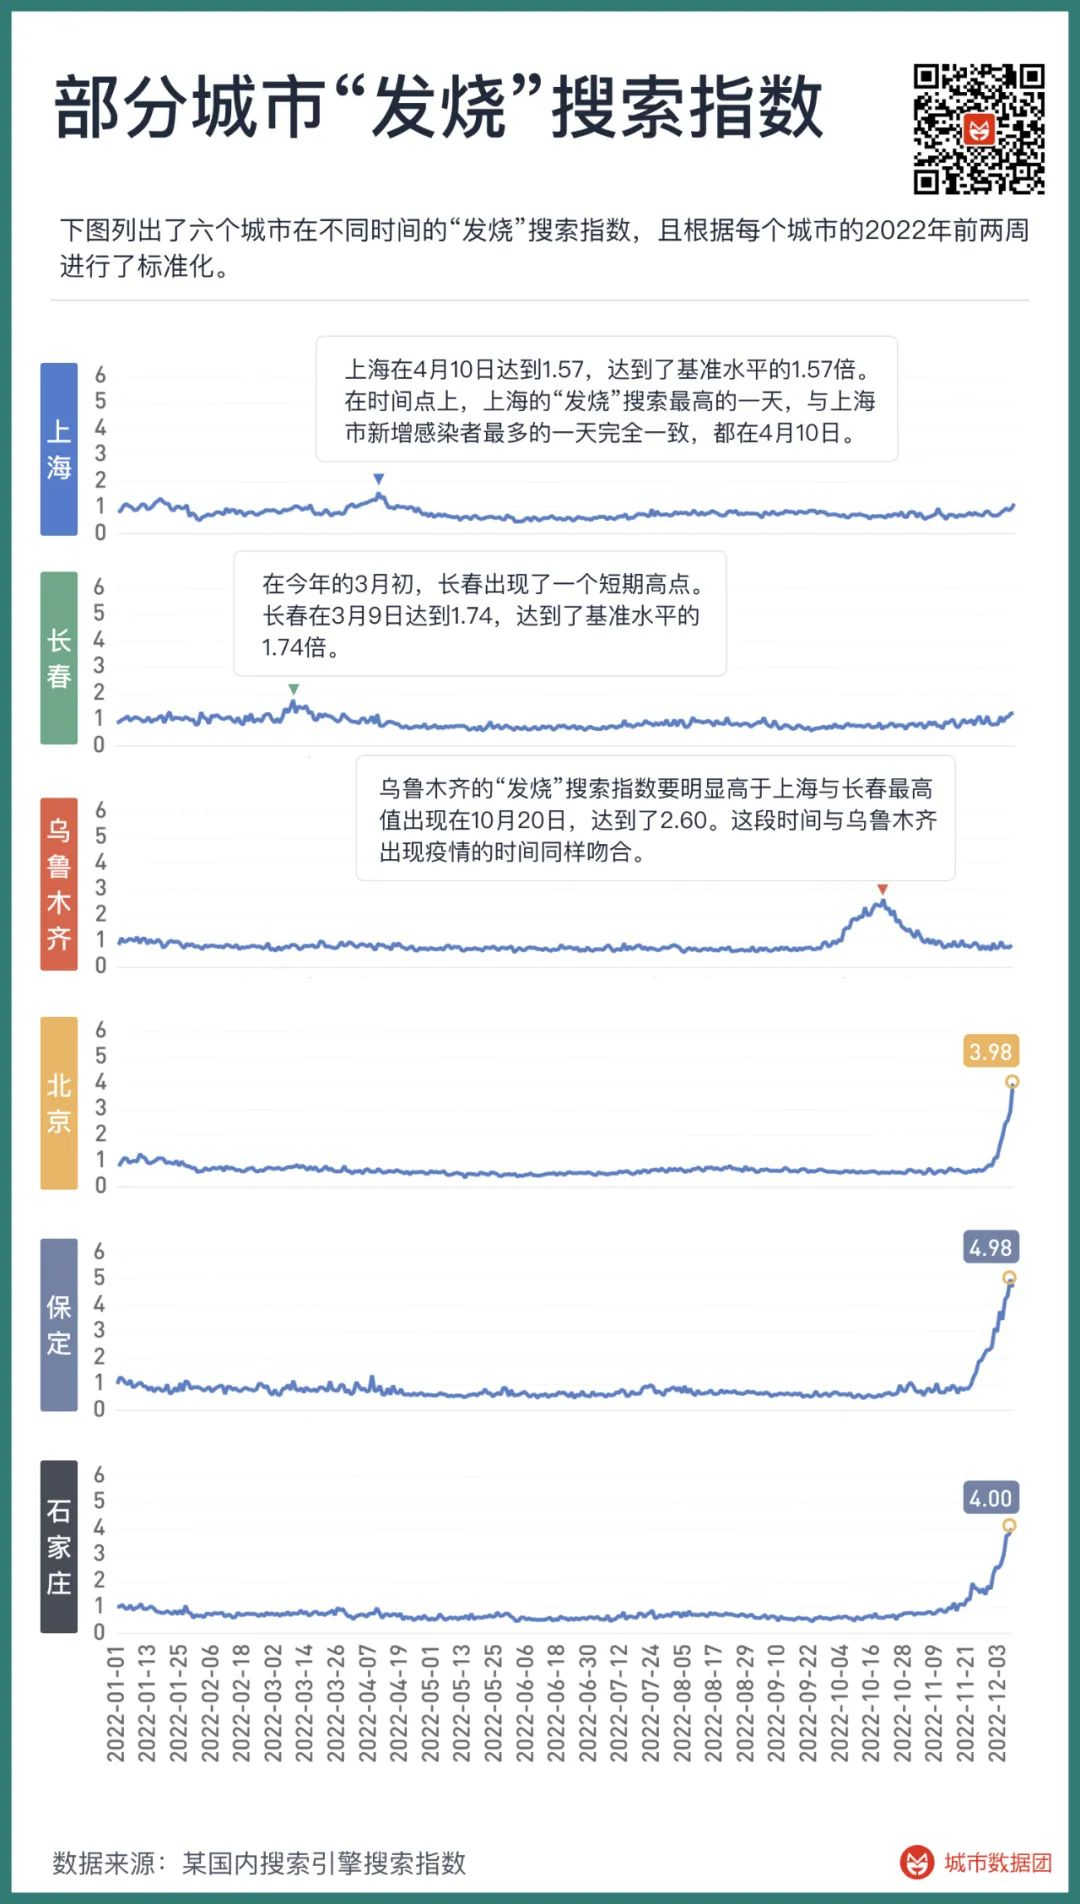
The figure above lists the “fever” search indexes of six cities at different times, and is standardized according to the first two weeks of 2022 for each city.
It can be seen that in early March and early April of this year, Changchun and Shanghai respectively had a short-term high point, with Changchun reaching 1.74 on March 9 and Shanghai reaching 1.57 on April 10. The “fever” search of these two cities at this time reached 1.74 times and 1.57 times of the benchmark level, respectively. At the time point, the day with the highest “fever” search in Shanghai was exactly the same as the day with the most new infections in Shanghai, both on April 10.
The next peak of “fever” index occurred in Urumqi in October, with the highest value appearing on October 20, reaching 2.60. This period coincided with the time when the epidemic occurred in Urumqi.
The highest value of the “fever” search index in Urumqi was significantly higher than that in Shanghai and Changchun, but why is the proportion of cases to the total population lower than that in Shanghai and Changchun? This may be related to the long-term lockdown and low frequency of nucleic acid testing in Urumqi, that is to say, the real cases in Urumqi are far more than the cases reported by the authorities, and even a considerable degree of mass infection has occurred – many serious medical teams across the country have been stationed in Urumqi on a long-term rotation since October, which also proves this point from the side.
The examples of Shanghai, Changchun and Urumqi show that the “fever” search index is highly correlated with the large-scale Omicron epidemic. Even when the number of confirmed cases cannot fully reflect the actual situation in the local area, the “fever” search index still faithfully presents the extent to which the epidemic has spread. It is in these few more serious epidemics that the “fever” search index has only reached about twice the benchmark level.
So, when we see the “fever” index of Baoding, Shijiazhuang and Beijing breaking through the benchmark value by 3 times, 4 times or even 5 times at an astonishing speed, and there is no sign of stopping at all, it is not difficult to imagine what the actual situation is like.
Mass infection is starting in these cities
After analyzing the data of multiple regions, we tried to use the “fever” search index to give the signal of the beginning of the epidemic in each region, mainly including two parts:
1, the average value of the “fever” search index in the past 7 days is greater than 2 standard deviations of the average value of the quarter in the past five years.
2, the Cox-Stuart test of “fever” search shows a significant upward trend at the 95% level. Here, we use 7-day data for the Cox-Stuart test.
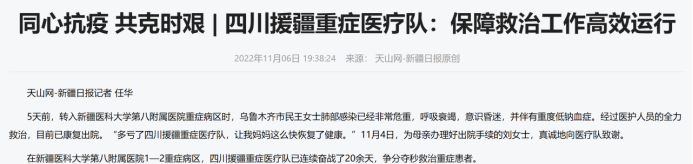
When the above two conditions are met at the same time, we define the first day when the upward trend appears as the first day for the city to move towards mass infection. Since November 2022, the cities that have experienced mass infection are as follows:
It can be seen that the start time of this round of the epidemic is earlier than we thought. On the first day of the release of the “Twenty Articles”, that is, November 11, Shijiazhuang City and Xingtai City of Hebei Province began to move towards mass infection, and it has lasted for nearly a month, and there has been no sign of slowing down.
The second batch to enter mass infection were Lanzhou, Gansu, Luoyang, Henan and Baoding, Hebei, from November 17 to November 18.
In the next two weeks, Handan, Langfang, Tangshan, Cangzhou, Hengshui, Zhangjiakou… Except for Chengde City, which is temporarily stable, the whole territory of Hebei Province has already begun mass infection.
Mass infection in Henan is also progressing rapidly. After Luoyang, it was followed by Xinxiang, Shangqiu, Nanyang, Zhengzhou, Zhoukou, Pingdingshan, and Kaifeng.
After Lanzhou in Gansu, Linxia and Gannan autonomous prefectures also began mass infection in late November.
Beijing is the first big city in the country to enter mass infection, and the time point is November 27. Next are Chongqing, Wuhan, Kunming, Chengdu…
As of December 9, 240 million people across the country have embarked on the road of mass infection.
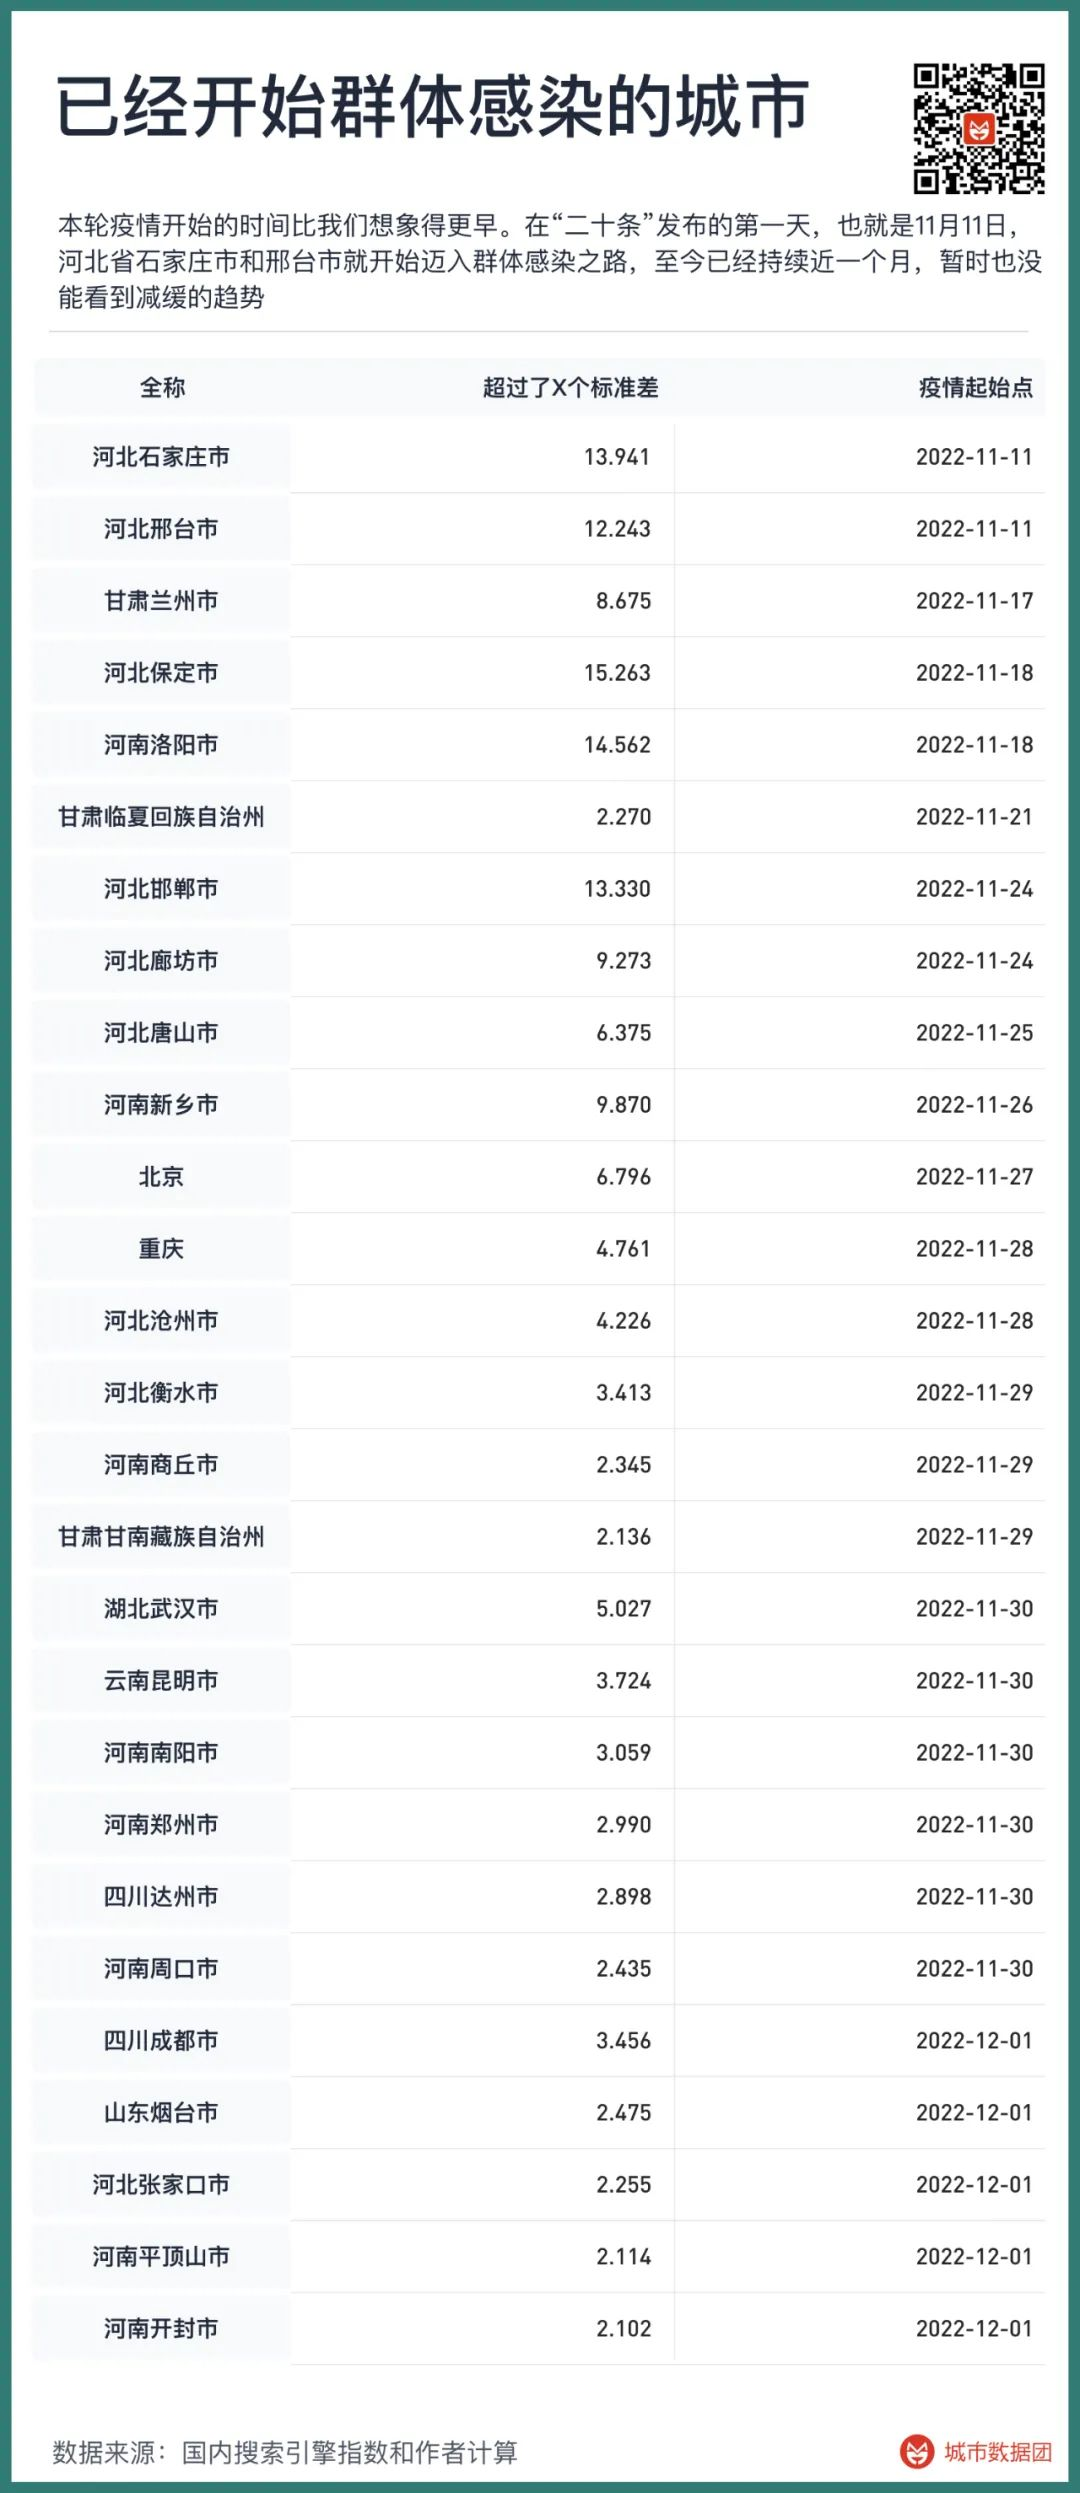
This is just the beginning. Since our method is to look back seven days after the confirmation of mass infection, if the infection in a city starts after December 2, it cannot be locked by the signal. Therefore, although some cities have obvious trends of infection, they have not been included in the table, and these cities are as follows.
If the upward trend of these cities does not change, they will be officially confirmed to enter mass infection in about a week, and their total population is about 116 million.
That is to say, at the moment when our article is published, there may already be 360 million people across the country who have begun to embark on the road of mass infection.
How many excess deaths may be caused after mass infection?
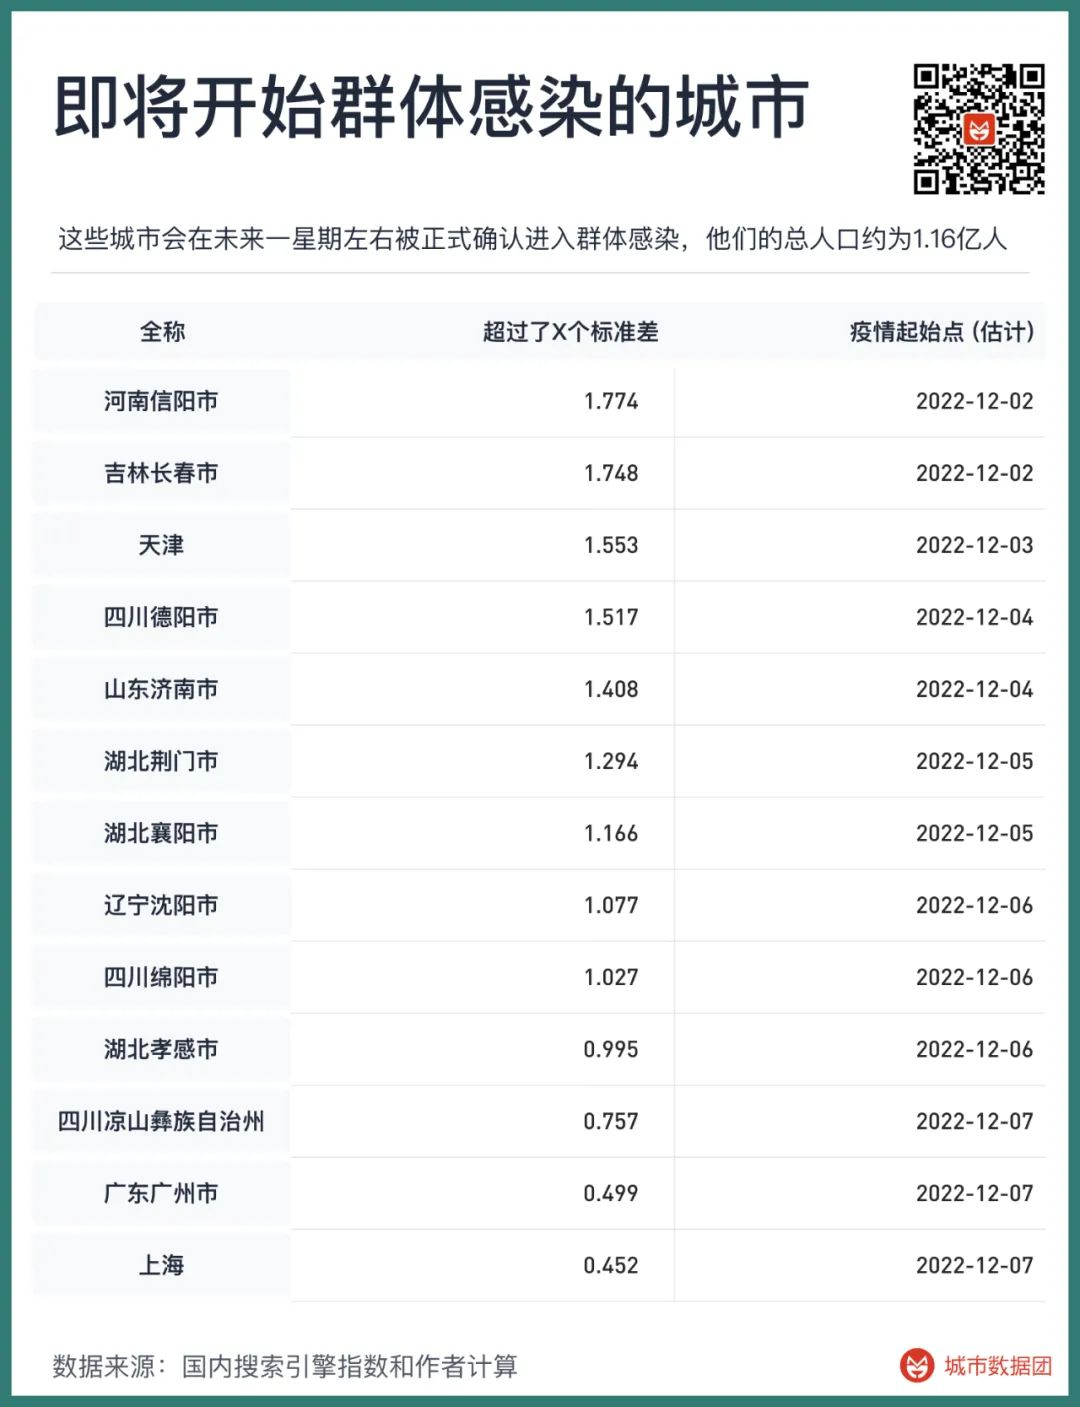
From the data of Hong Kong Special Administrative Region, Singapore and Taiwan region, the first round of infection brought by the Omicron variant generally lasts for about 2 to 4 months, and the time from the beginning of the epidemic to the peak is half of the total duration, about 1 to 2 months.
In the peak period of the first round of infection, excess deaths will reach a high level.
The figure above lists the excess deaths in each month in four regions since 2022. In Singapore and Taiwan region, the excess deaths caused by the first mass infection of Omicron reached more than 40% (the first round of mass infection in Singapore was in 2021, which is not shown in the figure) – that is, the number of deaths in the month is 40% higher than the number of deaths in the absence of the epidemic. At present, the excess mortality rate in these regions is stable at about 15%-20%.
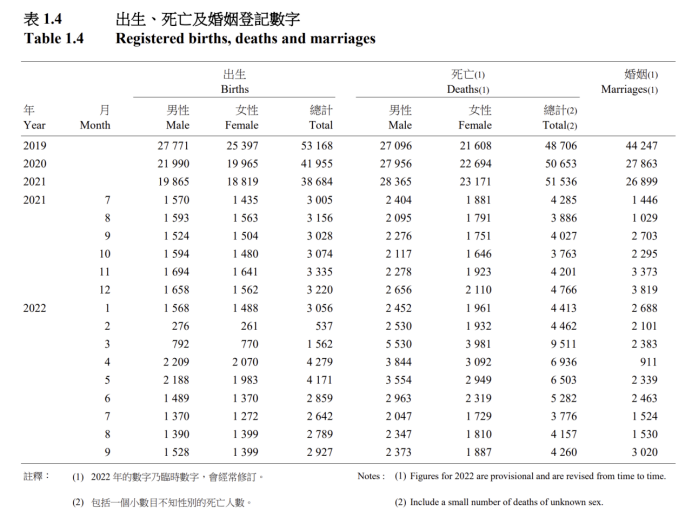
In the Hong Kong Special Administrative Region, the excess mortality rate of the first mass infection reached more than 150%.
From the November 2022 issue of the “Hong Kong Monthly Digest of Statistics” in the figure above, it can be seen that Hong Kong, where the number of deaths was originally stable at more than 4,000 people per month, died 9,511, 6,936 and 6,503 people in March, April and May of this year, respectively, with more than 9,000 more deaths. The number of deaths in the three months is similar to the number of deaths in more than five months without the epidemic.
Therefore, although we can see huge changes in publicity, such as the virulence of the Omicron variant has become milder than the flu, we still have to admit several objective facts –
1, the current medical resources in mainland China are still far from Singapore, Japan, Taiwan region and Hong Kong Special Administrative Region.
2, the current vaccination level in mainland China, especially the vaccination level of the elderly over 80 years old, is far inferior to Singapore, Japan and Taiwan region, slightly exceeding the Hong Kong Special Administrative Region at the beginning of this year, but due to the stagnation of vaccination for half a year, the immune level is constantly declining.
3, Singapore, Japan and other places, even with a high vaccination rate, good medical conditions, and the rise of immune level brought by several rounds of virus infection, the excess mortality rate is still stable at 15%-20% as of November. Taiwan region died 17,719 people in November 2022, and the average number of deaths from 2019 to 2021 was 14,480, an increase of 22.4%; South Korea died 29,199 people in September 2022, and the average number of deaths from 2019 to 2021 was 24,528, an increase of 19%; Singapore died 2,125 people in September 2022, and the average number of deaths from 2019 to 2021 was 1,806, an increase of 17.6%; Japan died 127,040 people in September 2022, and the average number of deaths from 2019 to 2021 was 110,289, an increase of 15.2%; Hong Kong Special Administrative Region died 4,260 people in September 2022, and the average number of deaths from 2019 to 2021 was 3,973, an increase of 7.2% – the excess mortality rate in Hong Kong in September was relatively low compared to other East Asian regions, and a very important reason was that the excess mortality rate in March-May was extremely high, which led to many people who died in the first round of infection, and these people might have died in subsequent infections if they lived in other regions.
Therefore, the excess deaths in the above-mentioned regions can basically be regarded as the lower limit when China is facing the first wave of excess deaths. If calculated according to the lower limit of excess deaths in these regions, that is, the excess deaths in the first round of the epidemic are only 40% according to the figures in Taiwan region, and the subsequent excess deaths are only 15% according to the current figures in Japan, then according to the base of 10 million deaths in China every year, the excess deaths in the next year will also be close to or even reach 1.7 million.
And this is only the lowest estimate under the best circumstances.
The Omicron strain has indeed become weaker, but from the actual death data of those regions with better coexisting conditions than China, it will still bring a large number of excess deaths. In this regard, we must have a clear understanding and sufficient psychological preparation.
The best time to open up
1.7 million, a huge number. Many people may have questions: Is it really appropriate to open up now?
The answer is simple, we should not only open up now, but should have opened up at an earlier time.
That time was March of this year.
From the perspective of immune level, in March of this year, when Jilin and Shanghai successively experienced epidemics, our three-dose vaccination was just over, and most people were having the best protection. Instead of now, when many people have not been revaccinated for a year, and the neutralizing antibody titer has dropped significantly.
From the perspective of medical resource supply and demand, in March of this year, we were facing a gradually warming time point, rather than entering the winter when cardiovascular and respiratory diseases are prone to occur. According to the 2020 census data, the number of deaths in December, January and February is 4.5% higher than that in April, May and June. In winter, it is more difficult to cope with mass infection, and medical resources are more strained than in spring.
From the perspective of virus virulence, although the virulence of Omicron itself is significantly lower than that of the previous Delta, its various variants, from BA2 in March of this year, BA5 in July, to the current XBB, BF.7, BQ.1, have not shown any tangible evidence of weakening virulence and reducing pathogenicity. The main reason why we see that the number of deaths in many regions is gradually decreasing under the infection of wave after wave of Omicron is that these regions have been fully vaccinated and the immune level has increased after mass infection. For the first round of infection of the population with a low immune level, there is no significant statistical difference in the pathogenicity and hospitalization rate of various Omicron variants.
From March to November, we have not waited for a more “friendly” Omicron variant.
Therefore, if we entered mass infection in March of this year, our various conditions would be better than, or at least not worse than, the current situation. The first impact caused by the epidemic will also be more gentle than it is now.
Not to mention that many policies that have just been introduced, such as antigen screening and home isolation for mild cases, are exactly the same as in March.
But in March of this year, we chose to continue the lockdown.
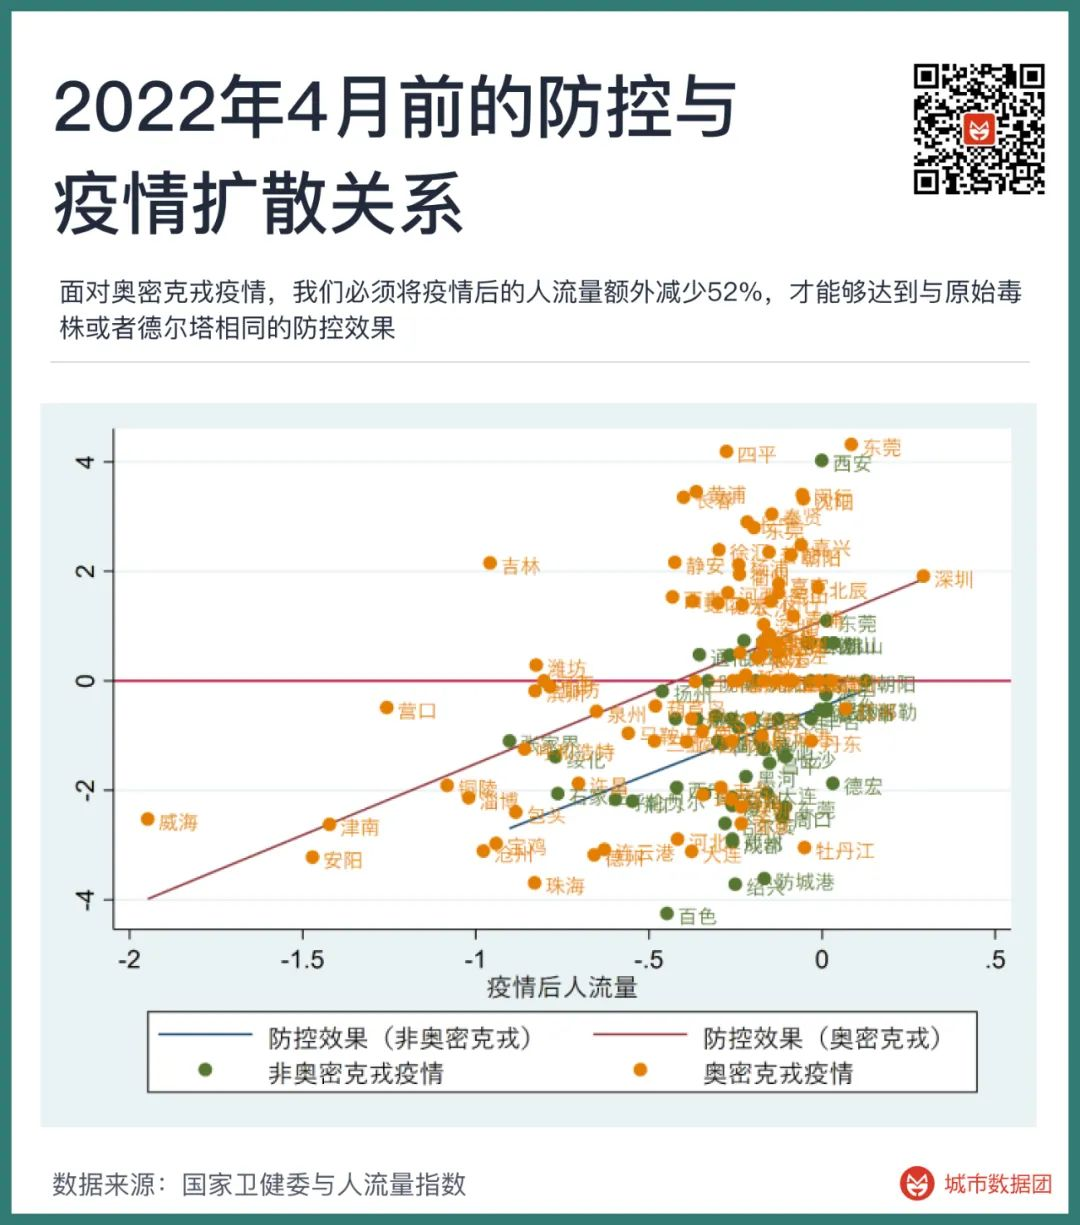
In April of this year, I wrote an article, “How strong a lockdown policy can prevent Omicron?”. In that article, we found that the difficulty of preventing and controlling Omicron was far higher than that of the previous strains in 2021 and before, as shown in the figure below:
The meaning of the figure above is that in the face of the Omicron epidemic, we must reduce the passenger flow after the epidemic by an additional 52% in order to achieve the same prevention and control effect as the original strain or Delta.
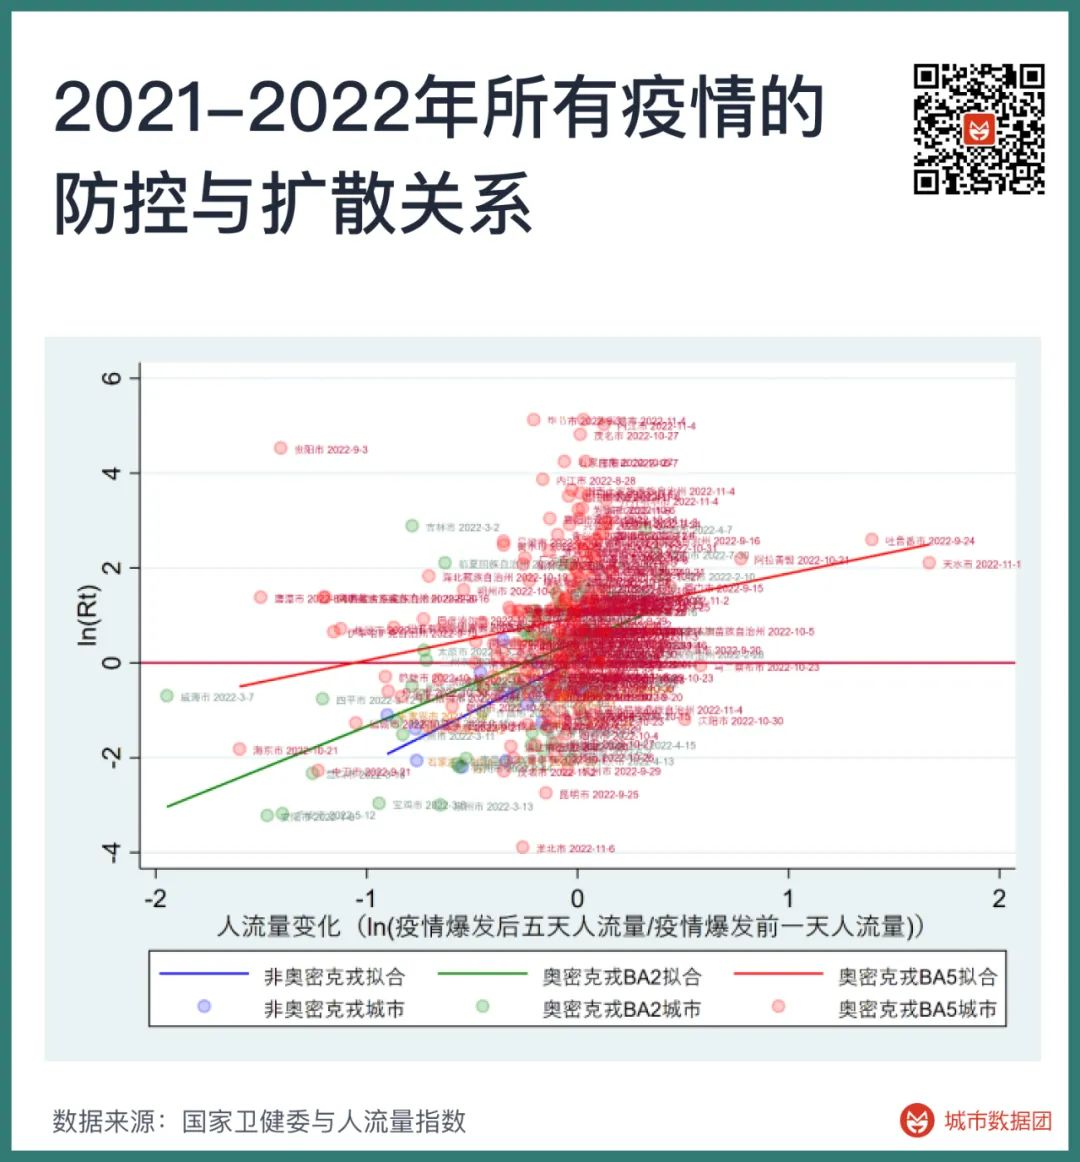
Now, we have added the epidemic data from April to November in various places, and added a set of points and a line on the basis of the above figure, as shown in the figure below.

The red line in the figure above is the prevention and control effect curve of the epidemics from June to November, and the green and blue lines correspond to the Omicron BA.2 epidemic in the first half of this year and the earlier original strain or Delta epidemic, respectively.
It can be seen that the green line (Omicron BA.2) has moved up one unit compared to the blue line (original strain and Delta), and the red line (Omicron BA.5 and subsequent strains) continues to move upwards, and the slope has become lower. This means that the effect of reducing the spread of the epidemic through lockdown has become worse, so more strict lockdown is required to achieve the same effect.
If the degree of reduction in passenger flow after the epidemic is regarded as the cost of lockdown, then in the period of the original strain, the BA.2 period in the first half of the year and the BA.5 period from June to November, the cost of controlling the spread of the virus to a similar stable level is 27%, 100%, and 350%, respectively.
The cost of controlling the epidemic caused by BA.5 and subsequent variants is 13 times that of the original strain and 3.5 times that of the BA.2 strain.
Some people attribute the responsibility of “uncontrollable” to the lack of strict management of imported cases from abroad, for example, they believe that changing from 14+3 to 7+3 is the culprit of the failure of prevention and control. This obviously ignores the huge differences brought about by the mutation of the strain. Except for a very few cities, the vast majority of regions across the country have no ability to prevent and control BA.5 and its subsequent strains. Even if the cases imported from abroad and leaked into the country are reduced by 99% from the current level, it can only postpone the current mass infection time by half a month, which is no different from the current situation.
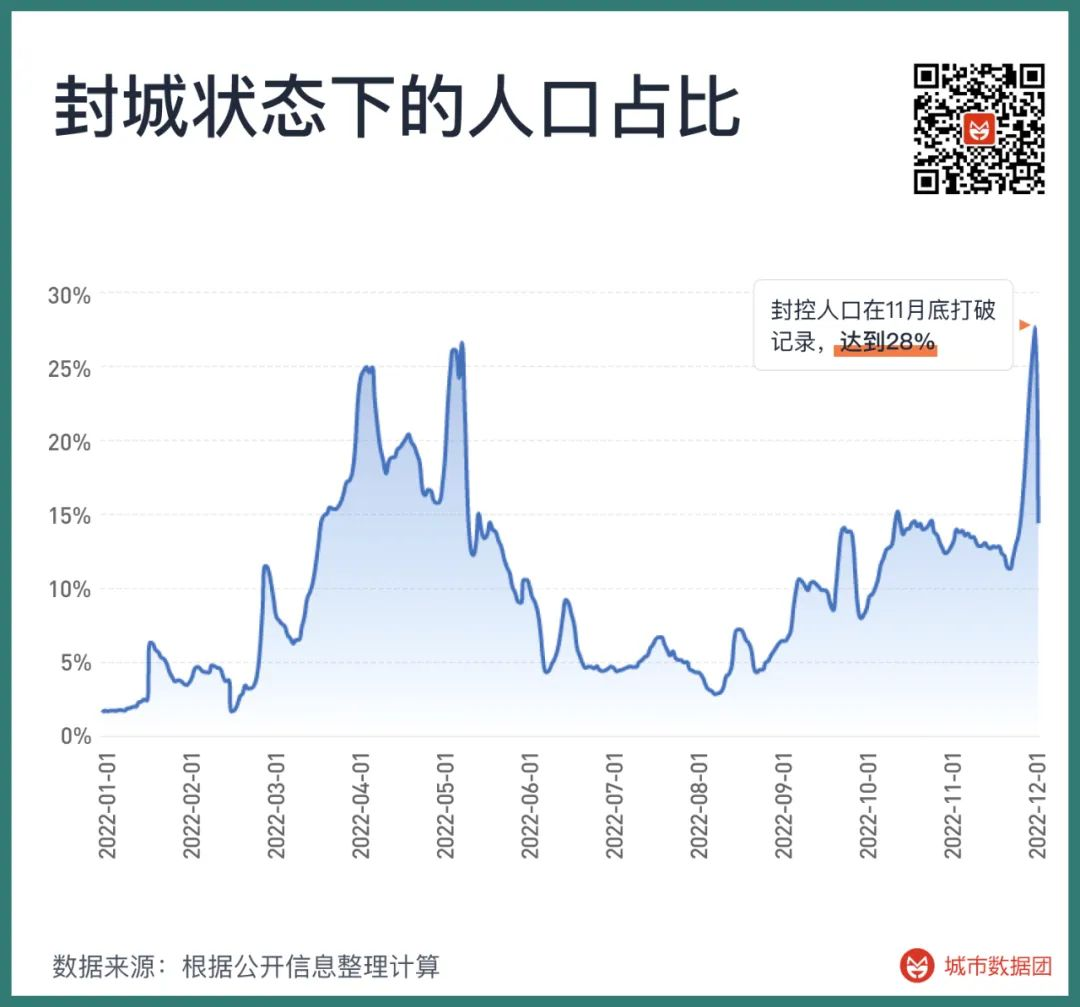
The attempt to prevent and control BA.5 and subsequent strains has brought large-scale city lockdowns since the second half of this year. If the passenger flow is less than 50% of the normal value, and the local cinemas are completely closed, it is regarded as a sign that a region is in lockdown, then the proportion of the population in lockdown across the country since this year is shown in the figure below – in early April, 25% of the population was once in lockdown. And at the end of November, this number broke the record, exceeding 28%.
If the number of days of lockdown is added up for each region that has been locked down, and the population whose lockdown time is less than 5 days is removed, and the population that has been locked down for more than 6 days or more is all aggregated.
Then from the beginning of March to the end of November this year, 1 billion people in China have experienced lockdown, and they have been locked down for an average of 27 days.
The same caliber of the number of people in lockdown was only 27 million in the same period of 2021, which is one-fortieth of that in 2022. In 2021, we can indeed confidently say that China’s epidemic prevention and control policy has low cost, good effect, and can protect both the economy and life.
But the path dependence on the successful policy of the past has also caused us to miss the best time to open up in 2022, and China can only turn the policy direction at a worse time.
So, if the current time to open up is worse than before, can we wait a little longer and wait for a better time to open up?
It’s not impossible, but it will be another gamble.
Betting that the already stable Omicron variant will suddenly disappear at some point, or be replaced by a new strain with a greatly reduced virulence.
Betting that we will have an efficient way to increase the vaccination rate of the elderly in the future and reach the world’s leading level. Although we have done nothing in the past few months, the vaccination rate of the elderly over 80 years old is still the lowest in the world.
Betting that we will suddenly invent a better new coronavirus specific drug, so that the 1.7 million excess deaths that may occur after opening up will be greatly reduced.
Yes, we can certainly stay at the table like we did in March of this year, continue the original policy, and pray for a better time to fall from the sky.
However, to stay at the table, we must bet again. What are these bets?
It doesn’t seem like much, but it’s not a small amount.
1 billion people, their 27 days.
Discover more from 自由档案馆
Subscribe to get the latest posts sent to your email.